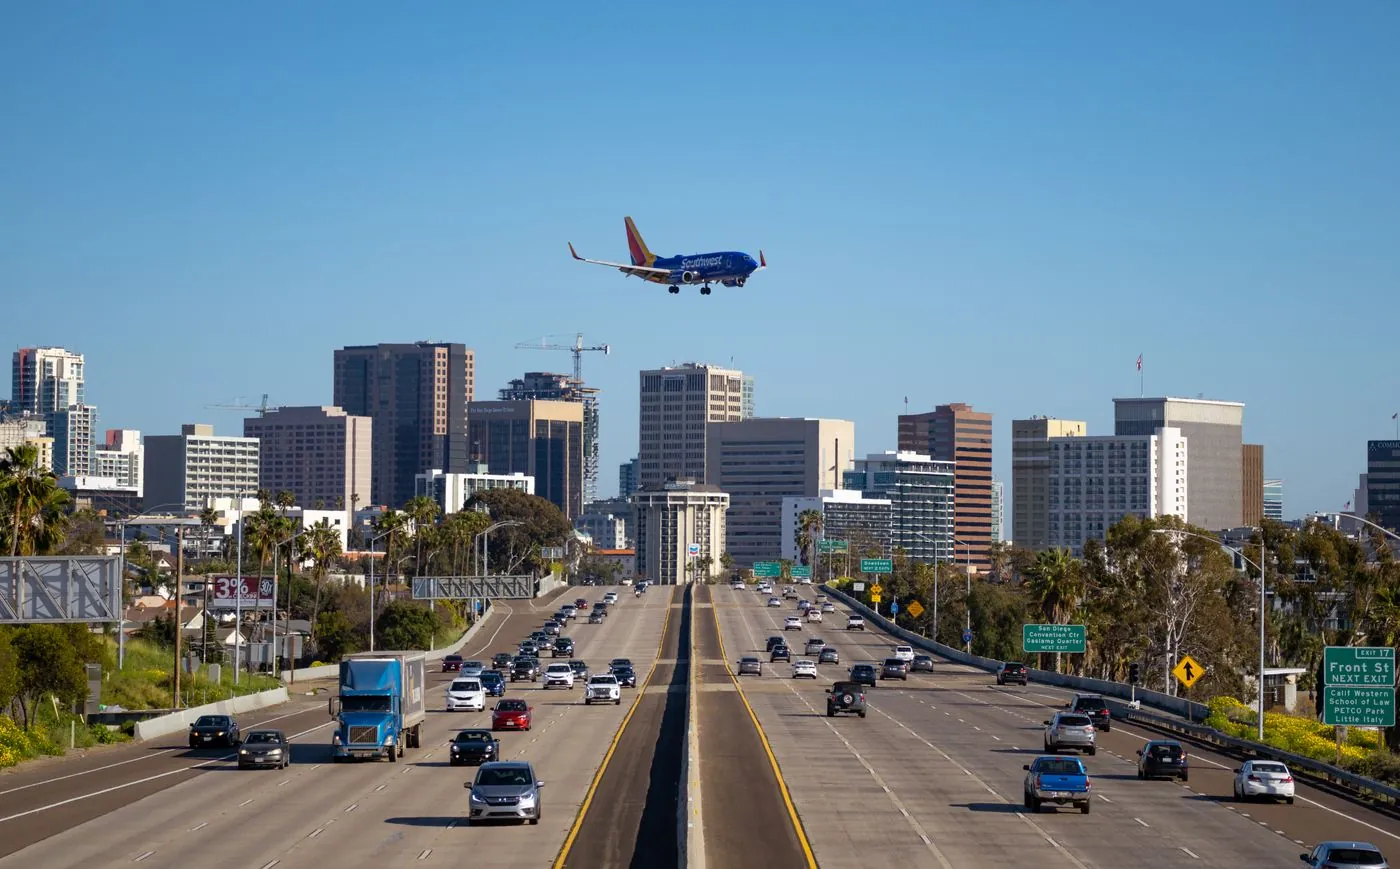
San Diego's reputation is for easy driving, and the morning mostly earns it. The afternoon is a different city. Here is what the agency data says, when each corridor peaks, and how to find the best time to leave for your route.
Nineteen of the twenty worst jams are afternoon jams
Caltrans District 11's Mobility Performance Report ranks the region's bottlenecks by vehicle-hours of delay. For calendar year 2024, the split is stark:
| rank | location | peak | vehicle-hours |
|---|---|---|---|
| 1 | I-805 SB north of I-15 | PM | 736,327 |
| 2 | I-5 NB at Lomas Santa Fe Dr | PM | 592,440 |
| 3 | I-15 NB south of El Norte Pkwy | PM | 541,218 |
| 4 | I-5 SB, 5th Ave | PM | 366,062 |
| 5 | SR-125 SB at Grossmont Blvd | PM | 325,603 |
| 6 | I-15 NB HOV south of SR-78 | PM | 318,754 |
| 7 | I-805 SB at University Ave | PM | 256,900 |
| 20 | SR-78 WB at Nordahl Rd | AM | 116,365 |
The district total is 6.1 million vehicle-hours of delay at the 60 mph threshold, and Caltrans notes that all 6.1 million of them were generated in San Diego County.
The practical conclusion is unusually clean: if you can move a trip, move the afternoon one. Shifting a 5:30 p.m. departure to 7:30 does more for you here than any morning adjustment.
San Diego loses more time than you would guess
The Texas A&M Transportation Institute's 2025 Urban Mobility Report, using 2024 data, puts the San Diego auto commuter at 88 hours of delay a year — eighth worst in the United States. The average across all 494 urban areas it studies is 63 hours.
So San Diego commuters lose roughly 40% more time than the typical American commuter, which sits oddly beside the city's easy-going reputation. (That figure is TTI's. Don't compare it to INRIX numbers — the two use different methods and are not interchangeable.)
FHWA separately ranks I-5 in San Diego 21st among the most-travelled highway locations in America, at 312,000 annual average daily traffic.
The commute shares a road with an international border
This is the thing that makes San Diego's network unlike any other US metro's.
The General Services Administration describes San Ysidro as the busiest land port of entry in the Western Hemisphere, processing 70,000 northbound vehicles and 20,000 northbound pedestrians every day. Federal border-crossing data recorded 14,829,472 northbound personal vehicles at San Ysidro in 2024, plus 6,766,420 pedestrians.
Waits are long and published live. On one evening in October 2026, Customs and Border Protection's own feed showed a 160-minute general passenger-vehicle wait at San Ysidro, with 6 of a possible 34 lanes open — and 10 minutes in the SENTRI lane. CBP publishes these at bwt.cbp.gov, which makes them checkable before you leave rather than discoverable in the queue.
Otay Mesa, the commercial crossing, took 1,059,759 northbound trucks in 2024 and is the busiest California–Mexico commercial border crossing. SANDAG's cross-border travel survey found that roughly 31% of Mexico residents crossing north were travelling for work.
When is San Diego traffic worst?
Caltrans District 11 uses AM peak 6:00–10:00 a.m. and PM peak 3:00–7:00 p.m. By corridor:
- I-805 — the inland bypass that leaves I-5 near San Ysidro and rejoins it about 28 miles north. Its southbound approach to I-15 is the single worst bottleneck in the district.
- I-5 — the coastal spine, and the only San Diego route FHWA ranks nationally. It fails in both directions in the afternoon: northbound at Lomas Santa Fe and southbound through downtown.
- I-15 — the North County commute, worst northbound in the afternoon as traffic stacks south of El Norte Parkway. Its HOV lane south of SR-78 is a separate top-six bottleneck in its own right.
- SR-125 — the East County connector, southbound at Grossmont Boulevard, afternoon.
- SR-78 — the east–west North County route, and home to the district's only top-twenty morning bottleneck, westbound at Nordahl Road.
- SR-163 — the short canyon run from downtown to Mission Valley, backing up northbound just south of I-8 in the afternoon.
Worth noting what is not on that list: I-8 and SR-52 do not appear in District 11's twenty worst bottlenecks. I-8 carries heavy volume but does not generate top-tier delay. SR-78 and SR-125 both outrank it.
Prefer a leave-by time to a set of windows? Put your arrival time into the departure time calculator and it will work out when to go.
Three San Diego-specific things that move the peak
- The border is part of the network. 70,000 northbound vehicles a day at San Ysidro, 1.06 million trucks a year at Otay Mesa, and live waits that can exceed two and a half hours. If any part of your trip touches a crossing or its approach, the border queue is your commute.
- Military traffic is on its own schedule. Naval Base San Diego reports over 35,000 military, civilian and contract personnel and homeports 54 ships. Camp Pendleton has over 42,000 active duty and around 70,000 people on base during the day. MCAS Miramar runs a base population of 20,000–22,000. Three installations that size generate arrival and departure surges no citywide rush-hour rule captures.
- It barely rains, and that is the problem. NOAA's 1991–2020 normals put San Diego at 9.79 inches of annual precipitation. Nationally, FHWA finds 75% of weather-related crashes occur on wet pavement and heavy rain cuts freeway speeds by up to 17%. Rain is rare enough here to be genuinely out of practice — see how weather affects traffic and leave-time apps with weather alerts.
Why your best time is route-specific
I-805 southbound at I-15 does not peak like SR-78 westbound at Nordahl — one is afternoon, the other is the district's only top-twenty morning bottleneck. An inbound trip is not an outbound one, and a route that touches the border is a different category entirely. Citywide advice smooths over exactly the differences that decide your drive. Nationally, the worst day of the week varies by city too.
Driving the I-5 corridor north? See the best time to leave Los Angeles, or the best time to drive through Los Angeles if you are passing through rather than stopping.
Find the best time to leave for your San Diego route
Google Maps and Waze show live traffic and turn-by-turn once you are already on the road. BoardSpy is the leave-time app: it checks your saved San Diego route before you leave, recommends when to go, sends traffic and weather alerts, and tracks delay and on-time stats including your best and worst days. When you set off, it opens your map app for turn-by-turn. For how routing apps differ from departure-timing tools, see best app to avoid traffic.
Nearby cities
Every metro is listed on Best time to leave by city.
Frequently asked questions
What is the best time to leave to avoid traffic in San Diego?
Before 6:00 a.m. or after 10:00 a.m. in the morning, and outside 3:00–7:00 p.m. in the evening — the peak windows Caltrans District 11 uses. The afternoon matters far more here than the morning: of the twenty worst bottlenecks in Caltrans' calendar-2024 ranking, nineteen occur in the PM peak and only one in the AM. If you can shift only one trip, shift the afternoon one.
When is San Diego rush hour?
Caltrans District 11 defines the morning peak as 6:00–10:00 a.m. and the evening peak as 3:00–7:00 p.m. The evening is overwhelmingly the heavier of the two. The district recorded 6.1 million vehicle-hours of delay at the 60 mph threshold, all of it generated in San Diego County.
What is the worst road in San Diego?
Southbound I-805 approaching I-15, which Caltrans ranks the district's worst bottleneck at 736,327 vehicle-hours of delay in the afternoon peak. I-5 is next, failing in both directions in the PM — northbound at Lomas Santa Fe Drive and southbound through downtown. Notably, I-8 and SR-52 do not appear in the twenty worst at all.
How bad is San Diego traffic compared to other cities?
Worse than its reputation. The Texas A&M Transportation Institute puts the San Diego auto commuter at 88 hours of delay a year in 2024 — eighth worst in the United States, against a 63-hour average across the 494 urban areas it studies. That is roughly 40% more lost time than the typical American commuter.
How long are the border waits at San Ysidro?
They vary widely and Customs and Border Protection publishes them live at bwt.cbp.gov. On one October 2026 evening the general passenger-vehicle wait was 160 minutes with 6 of 34 lanes open, while the SENTRI lane was 10 minutes. The GSA describes San Ysidro as the busiest land port of entry in the Western Hemisphere, processing 70,000 northbound vehicles and 20,000 pedestrians daily. Check the live feed before you travel rather than joining the queue to find out.
How do I find the best time to leave for my San Diego commute?
Use a leave-time commute app that reads your actual route rather than only a live map. BoardSpy recommends when to leave for your San Diego route, sends pre-departure traffic and weather alerts, and tracks on-time performance and your best and worst traffic days. Download it here.