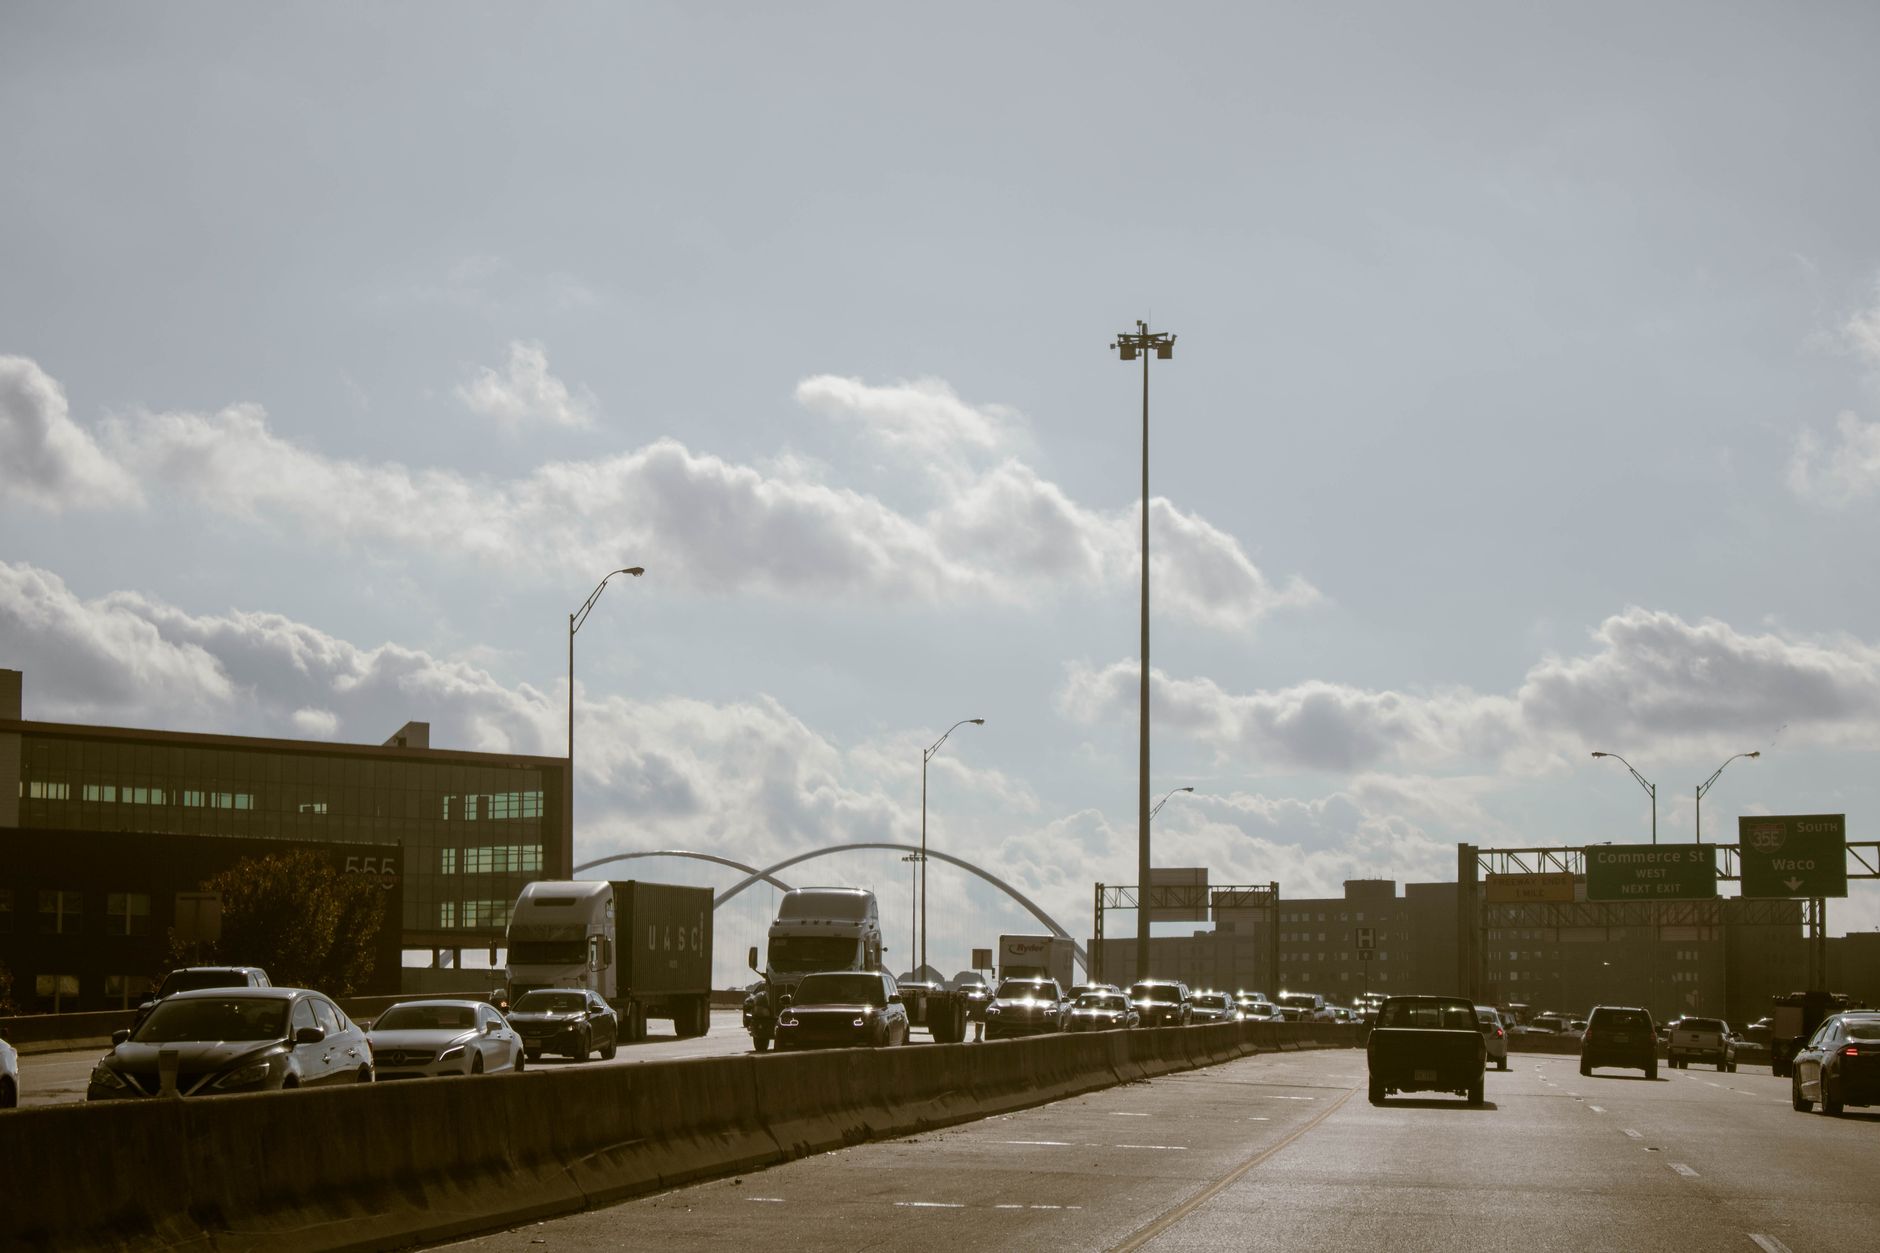
Here is the fuller picture, and then why that number is not much use for judging your own commute.
The 2024 numbers
| Measure | 2024 | 2023 |
|---|---|---|
| Average one-way commute | 27 minutes | — |
| Workers with a 60+ minute commute | 9.3% | 8.9% |
| Drove alone to work | 69.2% | 69.2% |
| Took public transportation | 3.7% | 3.5% |
| Worked from home | 13.3% | 13.8% |
Source: US Census Bureau, American Community Survey 1-year estimates, Table S0801.
The distribution matters more than the mean. The single most common commute band is 15 to 19 minutes, and over half of US commuters travel under 30 minutes each way. The 27-minute average is pulled upward by a long tail of very long commutes rather than describing a typical worker.
By state, the spread is wide: New York has the longest mean travel time at 33 minutes, North Dakota the shortest at 18.
The trend worth noticing
Two figures moved in opposite directions between 2023 and 2024, and together they tell a story.
Long commutes grew. The share of workers travelling 60 minutes or more rose from 8.9% to 9.3%.
Working from home fell, from 13.8% to 13.3%, while public transport use rose from 3.5% to 3.7%.
More people back on the road, and more of them travelling a long way.
One data note: the Census Bureau did not publish standard 2020 ACS 1-year estimates because pandemic conditions produced high non-response rates. Comparisons spanning that year need care.
Why the national average is a weak benchmark for you
It blends everything. Dense metros and rural counties, drivers and rail commuters, full-time and part-time. The result describes nobody in particular — which is why the state spread runs from 18 to 33 minutes around a 27-minute national figure.
Your metro matters more than your country.
Your corridor matters more than your metro. Two people in the same city with the same mileage can have completely different commutes depending on which road they use.
Your direction matters more than your corridor. Employment concentrates at one end of most routes, so traffic loads inbound in the morning and outbound in the evening. Travelling against the dominant flow at peak is frequently twenty minutes faster than travelling with it, on the same road at the same hour.
The number that actually matters: your range
If you track one thing about your own commute, do not track the average. Track the spread.
A 35-minute commute that ranges from 30 to 40 minutes is a completely different life from a 35-minute commute that ranges from 25 to 70.
The second forces you to plan for 70 minutes every single day, which means you effectively pay the worst case even on good days. No average captures that.
How to measure it: record your departure and arrival times for one week. Two columns, five rows. The gap between your best and worst day is the number worth attacking. From there, turn that average into a leave-by time for the arrival you actually have.
What counts as long
The Census Bureau defines extreme commuting as 90 minutes or more each way, and tracks it as a distinct category.
The Bureau of Transportation Statistics uses a separate measure, stretch commuting, for trips of at least 50 miles one way.
In practice most people’s tolerance drops sharply somewhere past 45 minutes each way — and unpredictability tends to bite before duration does.
Can you change yours?
Most commutes have more slack than people assume, and it is usually in the timing rather than the route.
Departure time is the biggest lever. On a typical metro corridor the spread between the best and worst departure time is around thirty minutes — larger than any route choice can recover.
The curve is steepest at the edges. Moving a 7:30 departure to 7:15 usually saves more than moving 8:00 to 7:45, because 7:30 sits on the steep climb and 8:00 sits near the flat top. Small shifts at the right moment beat large shifts at the wrong one.
The three-day test: leave fifteen minutes earlier for three days and record your arrival time. On most corridors the saving exceeds fifteen minutes. If it does not, you are past the steep part, and the answer is a different route or mode.
When the answer is structural
Some commutes cannot be timed out of trouble. The signs:
- Leaving thirty minutes earlier saves under ten
- Your route has one chokepoint with no alternative
- The gap between good and bad days exceeds forty minutes
At that point the options are a different route, a different mode, or a different work pattern.
On congested urban corridors, rail is often competitive — and the trade is worth stating plainly. Transit is usually not faster than a good drive. It is the same as a bad drive, every time. You give up the best case to eliminate the worst, which is a good deal when your real problem is unpredictability rather than duration.
That may be part of what the 2024 numbers show: public transport use rising while long car commutes grow.
Before you compare
Knowing you are above or below 27 minutes changes nothing about tomorrow morning.
BoardSpy tracks your actual route across real days and shows you your own range — then tells you before you leave which kind of day today is.
Hours lost also concentrate by city — compare the best time to leave Seattle to avoid traffic with the best time to leave Houston to avoid traffic. App landscape: Waze alternatives.
Frequently asked questions
What is the average commute time in the US?
The average one-way commute for American workers was 27 minutes in 2024, according to the US Census Bureau's American Community Survey, the most recent year published. The figure covers workers aged 16 and over who did not work from home.
Which US state has the longest commute?
New York had the longest mean travel time to work at 33 minutes in 2024. North Dakota had the shortest at 18 minutes.
What percentage of Americans have a commute over an hour?
9.3 percent of workers had a one-way travel time of 60 minutes or more in 2024, up from 8.9 percent in 2023.
What counts as an extreme commute?
The US Census Bureau defines extreme commuting as travel of 90 minutes or more each way. The Bureau of Transportation Statistics separately defines stretch commuting as trips of at least 50 miles one way.